
See Trends.
Spot Issues Early.
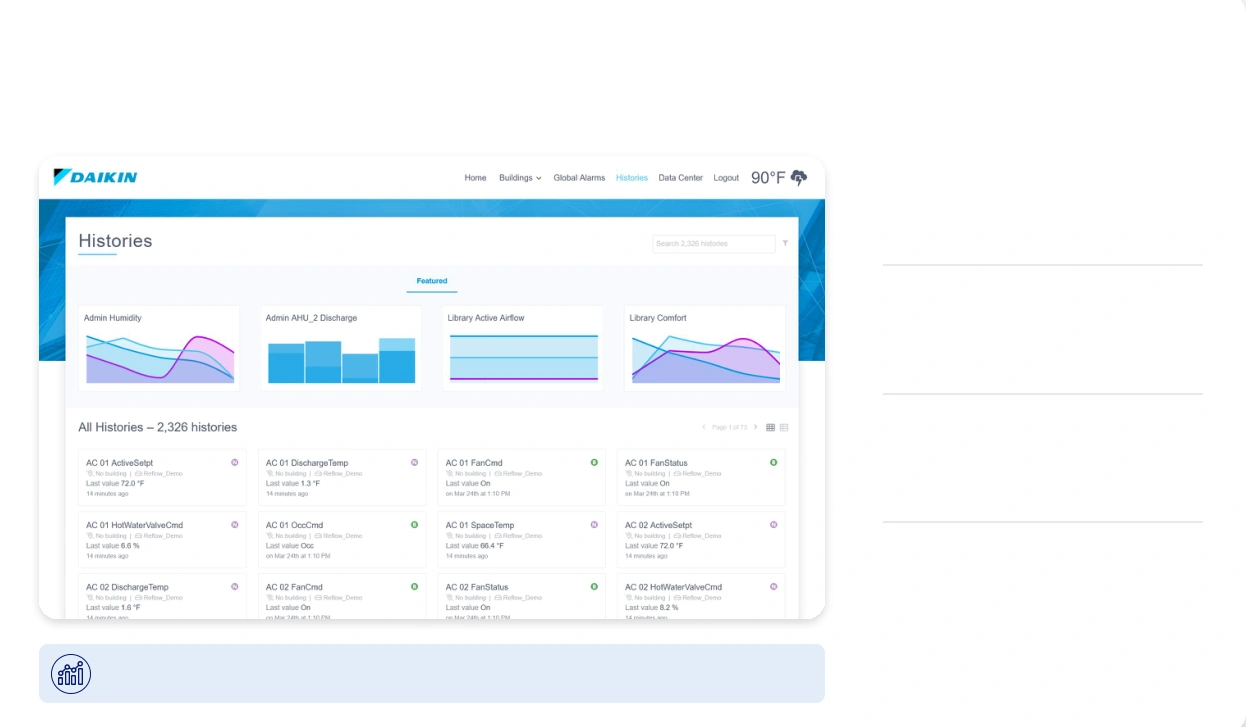
Historical data and trends help you understand what’s happening, identify the root cause and take action with confidence.
-

Trend Analysis
Visualize performance trends to spot anomalies and declining conditions.
-

Historical Context
Review detailed history to see when and how issues started or changed.
-

Compare & Drill Down
Compare data points and drill down to isolate the root cause.
-

Data You Can Trust
Accurate, time-stamped data from connected equipment you can rely on.
See the Full Story. Understand the Cause.
Access historical data and trends to uncover what’s driving an issue and make informed decisions before you arrive on site.
More than an alarm. It’s the history behind it. Better insight leads to the right fix.
Visualize Performance
See how key values change over time to identify patterns, drops and outliers.
Time Range Control
Adjust the time range to focus on the moments that matter most.
Drill Down for Details
Zoom in and explore the data to pinpoint exactly when an issue began.
Export & Share
Export chart data for reporting, documentation or sharing with facilities.